Demartek Publishes Exchange Server 2003 vs 2007 vs 2010 I/O Comparison Summary
Updated 4 May 2012
By Dennis Martin, Demartek President
With Exchange Server 2010, Microsoft has again made several changes to the Extensible Storage Engine (ESE) to increase performance and reduce the frequency of reads and writes. Two of the major changes are to perform fewer, larger and more sequential I/O operations and to increase the page size to 32KB. These changes reduce the number of I/O operations required to access mailbox data and increase the likelihood that data can be accessed in contiguous blocks. A complete explanation of these changes is available on Microsoft TechNet, with links provided in the reference section below.
Reasons for these changes include taking advantage of the superior performance of spinning disk drives with sequential read and write operations compared to random I/O operations, larger numbers of email messages commonly sent and received per day than in the past and an effort to make Exchange Server scale down into environments with less expensive storage infrastructures, including those with JBOD storage.
Exchange Server 2010 provides a unified high availability and site resilience solution known as mailbox resiliency, that uses multiple database copies. The table below refers to the single database copy only.
We are producing deployment guides for some of the technologies described in this document.
Contents
For Exchange Server 2010, Microsoft has eliminated the usage of the user profile terms “light”, “medium” and “heavy” to describe the estimated IOPS per mailbox and simply uses a numeric value for the average number of messages sent and received in a day. To see the old definitions for these profiles, see our older Exchange Server 2003 vs. 2007 I/O Comparison Summary page. In order to eliminate confusion and provide a side-by-side comparison of the estimated IOPS for Exchange Server 2003, 2007 and 2010, we have compiled the data provided by Microsoft for each of the three versions of Exchange Server into a single table for comparison. We have also provided some charts that help to visualize these differences.
For Exchange Server 2003, Microsoft provided user profile IOPS figures in multiples of 0.25, which result in specific numbers of messages sent and received per day. Beginning with Exchange Server 2007, Microsoft provided IOPS figures to achieve specific numbers of messages per day in multiples of 25 or 50. For Exchange Server 2010, Microsoft provided IOPS figures for higher numbers of messages per day than with previous versions of Exchange Server. Note that each successive verion of Exchange Server requires significantly fewer IOPS to achieve a particular level of daily message traffic.
The IOPS values in the table below can be used for JetStress testing for the appropriate version of JetStress.
 |
Exchange Server 2003 | Exchange Server 2007 | Exchange Server 2010 (Single database copy) |
|---|---|---|---|
| Architecture | 32-bit | 64-bit | 64-bit |
| Memory Usage | 4GB or less | up to 32GB or more | up to 32GB or more |
| DB Read:Write ratio | 3:1 ~ 2:1 | ~1:1 | 2:3, 1:1, 3:2 |
| DB Random I/O % | 100% Random | 100% Random | 100% Random |
| DB Page Size | 4KB | 8KB | 32KB |
| User Profiles Messages per day |
IOPS | IOPS | IOPS |
| 25 | — | 0.11 | — |
| 50 | — | 0.18 | 0.06 |
| 70 | 0.50 | — | — |
| 100 | — | 0.32 | 0.12 |
| 105 | 0.75 | — | — |
| 140 | 1.00 | — | — |
| 150 | — | 0.48 | 0.18 |
| 200 | — | 0.64 | 0.24 |
| 210 | 1.50 | — | — |
| 250 | — | — | 0.30 |
| 300 | — | — | 0.36 |
| 350 | — | — | 0.42 |
| 400 | — | — | 0.48 |
| 450 | — | — | 0.54 |
| 500 | — | — | 0.60 |
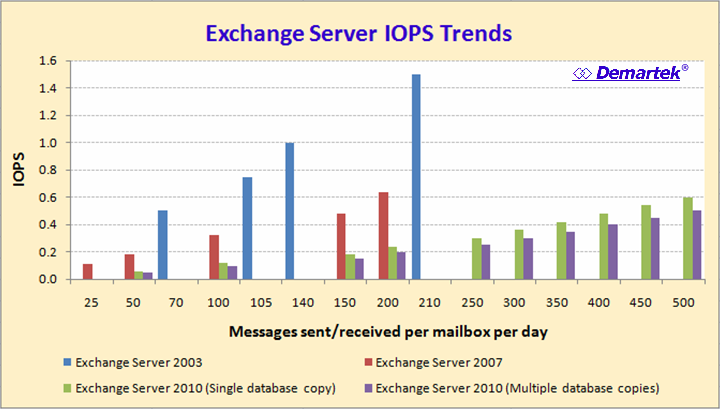
The Exchange Server IOPS Trends chart plots all the IOPS and messages per day data from the comparison summary table above.

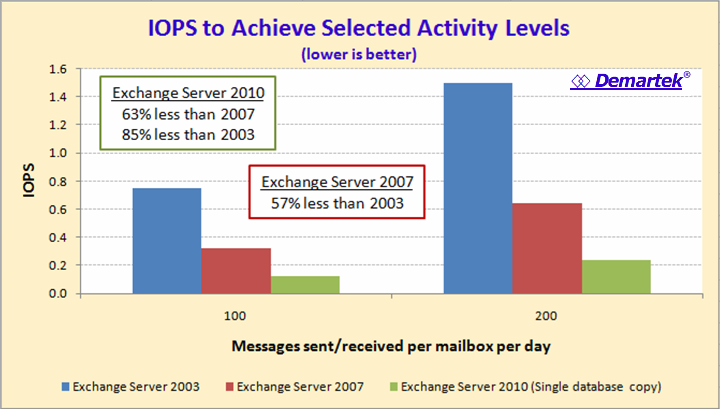
We selected two messages per day data points, the 100 and 200 messages per day for a little closer examination because data is available for all
three versions of Exchange Server in the comparison. The Exchange Server 2003 data points of 105 and 210 were close to the corresponding data
points for Exchange Server 2007 and 2010, so the charts approximate this data. The data shows that it takes fewer IOPS to achieve particular
numbers of messages per day for each newer version of Exchange Server as compared to the earlier versions, based on the data provided by Microsoft.

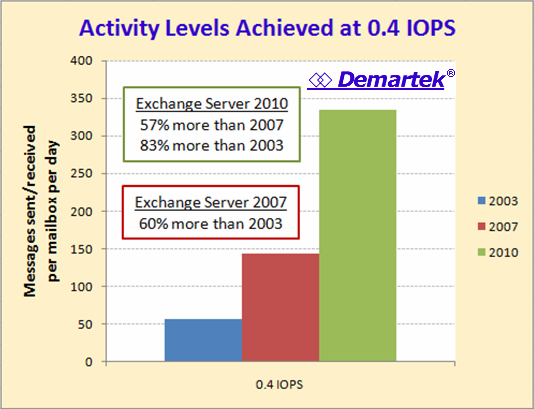
In this next graph, we wanted to determine how many messages per day could be achieved with a particular IOPS value. We chose 0.4 and extrapolated the
data, based on the figures provided by Microsoft. Each newer version of Exchange Server supports higher numbers of messages per day at a given IOPS value
than for the previous versions.

References to Microsoft TechNet for more detail:
- Exchange Server 2010 — Understanding Database and Log Performance Factors (including IOPS)
- Exchange Server 2007 — User Profiles and IOPS Requirements
- Exchange Server 2003 — User Profiles and IOPS Requirements
The original version of this page is available at www.demartek.com/Demartek_Exchange_2003_2007_2010_I-O_Comparison_Summary.html on the Demartek website.


 We are pleased to announce that Principled Technologies has acquired Demartek.